Signal Processing Techniques
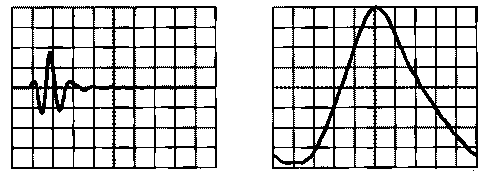
Signal processing involves techniques that improve our understanding of information contained in received ultrasonic data. Normally, when a signal is measured with an oscilloscope, it is viewed in the time domain (vertical axis is amplitude or voltage and the horizontal axis is time). For many signals, this is the most logical and intuitive way to view them. Simple signal processing often involves the use of gates to isolate the signal of interest or frequency filters to smooth or reject unwanted frequencies.
When the frequency content of the signal is of interest, it makes sense to view the signal graph in the frequency domain. In the frequency domain, the vertical axis is still voltage but the horizontal axis is frequency.

The frequency domain display shows how much of the signal's energy is present as a function of frequency. For a simple signal such as a sine wave, the frequency domain representation does not usually show us much additional information. However, with more complex signals, such as the response of a broad bandwidth transducer, the frequency domain gives a more useful view of the signal.
Fourier theory says that any complex periodic waveform can be decomposed into a set of sinusoids with different amplitudes, frequencies and phases. The process of doing this is called Fourier Analysis, and the result is a set of amplitudes, phases, and frequencies for each of the sinusoids that makes up the complex waveform. Adding these sinusoids together again will reproduce exactly the original waveform. A plot of the frequency or phase of a sinusoid against amplitude is called a spectrum.
The following Fourier Java applet, adapted with permission of Stanford University, allows the user to manipulate discrete time domain or frequency domain components and see the relationships between signals in time and frequency domains.
The top row (light blue color) represents the real and imaginary parts of the time domain. Normally the imaginary part of the time domain signal is identically zero.
The middle row (peach color) represents the the real and imaginary parts of the frequency domain.
The bottom row (light green color) represents the magnitude (amplitude) and phase of the frequency domain signal. Magnitude is the square root of the sum of the squares of the real and imaginary components. Phase is the angular relationship of the real and imaginary components. Ultrasonic transducer manufactures often provide plots of both time domain and frequency domain (magnitude) signals characteristic of each transducer. Use this applet to explore the relationship between time and frequency domains.

Exercise: Try replicating time domain signal in the upper left box in the app with a pattern similar to the image above. Note the resulting bandwidth in the frequency domain (magnitude) in the lower left box. Next try changing the magnitude, perhaps more of a "mountain" shape tapering to zero. Note that "narrowing" the magnitude, results in more cycles in the time domain signal.