Texture Measurement with EMATs II
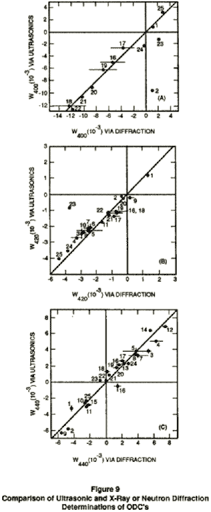
When using techniques sensitive to the anisotropic elastic properties of the sheet, one cannot recover the full set of ODC's. For fundamental reasons, the fact that elastic stiffness is described by a fourth rank tensor implies that Wlmn can only determine when one is less than or equal to four. For cubic metals, the independent members of this set are the ODC's, W400, W420, and W440. The technique is designed to quantitatively measure these ODC's. Comparison to independent X-ray and neutron diffraction measurements have shown a high degree of accuracy, as illustrated in Figure 9 (Thompson, Smith, Lee and Johnson, Met. Trans. 20A 1989).
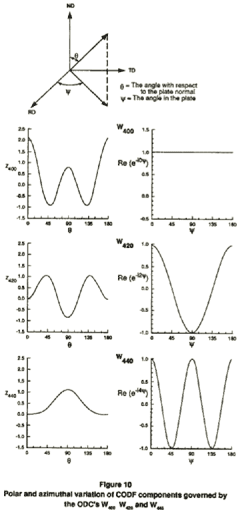
Despite their small number, the ODC's accessible by ultrasonic measurement play a major role in formability theory because of a strong correlation that exists between anisotropic elastic and plastic properties. As noted by Davies, Goodwill, and Kallend (Met. Trans. 3, 1627-1631, 1972), "the coefficient, W400, sets the overall value of average strain ratio J, W420 controls the tendency to form two ears during deep drawing while W440 controls the tendency to form four ears."
Figure 10 plots the polar Z(O) and azimuthal Re(e-lv) variations of these terms. W420 and W440 determine the weights of CODF components having twofold and fourfold variations, respectively, in the plane of the sheet. Theory, as shown in the azimuthal plots, provide information on planar anisotropy and correlate with a corresponding degree of earing. However, W400 controls the weight of a CODF component which is independent of orientation in the plane of the plate but varies with polar angle with respect to the plate normal. Hence, it is a measure of normal anisotropy.
The following applet may be used to calculate ODC's W400, W420, and W400 from Lamb wave velocities propagating at 0°, 45° and 90° with respect to the rolling direction. First choose the material. This assigns the correct elastic constants c11, c12, c44, and density for the cubic material being investigated. Next enter the "measured" Lamb wave velocities.
These correlations between elastic and plastic anisotropy have received extensive experimental study in the steel sheet industry. Experimental results (Stickles and Mould, Met. Trans. 1, 1303-1312, 1970; Mould and Johnson, Sheet Metal Ind. 50, 328-348, 1973) have demonstrated the correlation of the average Young's modulus
and its anisotropy
with the corresponding plastic anisotropy parameters, r-bar and delta-r as defined in earlier equations. Here E(theta) is defined as Young's modulus of a coupon cut at an angle theta with respect to rolling direction. These successful laboratory studies led to a commercial instrument presently used extensively in the steel industry (Modul-r®, Tinious Olsen, Willow Grove, Pa).
These ultrasonic techniques rest on the same physical principles. However, instead of requiring samples be cut from the sheet, anisotropic elasticity information is inferred from ultrasonic wave speed measurements. From this data, one can directly infer ODC's, as has already been illustrated in Figure 9. Alternatively, one can estimate the anisotropic value of Young's modulus, and hence E-bar and delta-E. This allows existing, well-known correlations to be used to predict r-bar and delta-r for a steel sheet. Finally, one can use the tool to gather raw data that will lead to other correlations between ultrasonic measurements and formability parameters.
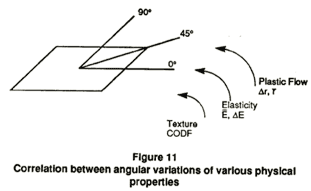
In summary, there is a quantitative correlation between the directionality of properties of a rolled metal sheet, such as the plastic strain ratio or elastic modulus, and the underlying texture. Figure 11 is an attempt to visualize this correlation. Just as the elastic and plastic properties of a sheet metal vary with direction (demonstrated by variation in Young's modulus, E, and plastic strain ratio, r), the distribution of grain orientations have their own angular variation.
Ultrasonics can characterize texture nondestructively and rapidly. Unlike the conventional X-ray techniques which have limited surface penetration, velocity measurements can assess the bulk texture using ultrasonic waves, Figure 12. This characterization capability, tempered with more quantitative analysis of the relation between texture and drawability, can be of great advantage to the enhancement of forming operations.
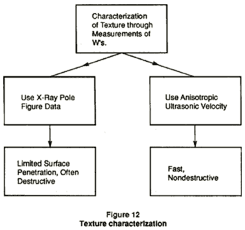
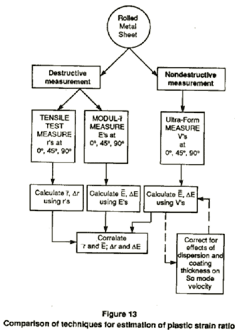
Figure 13 is a flow chart demonstrating the ultrasonic measurement technique as compared with tensile tests and Modul-r. The velocities of the ultrasonic waves are measured along the axes of expected maximum and minimum ductility (0, 45, and 90 degrees with respect to the rolling direction). Once corrected for effects of dispersion and coating, they are used to calculate the average Young's moduli in these directions. Calculated moduli will then be used to find the normal and planar anisotropy. This is done by using existing correlations. It can also be used as a tool to develop data necessary to define new correlations in related applications.
