Imaging Techniques
Microwave images can be thought of as 2D or 3D maps of the electromagnetic properties (e.g., permittivity, permeability, reflectivity, etc.) of what is being imaged, that vary based on the contrast of the properties of the sample and the sample’s geometry. Microwave images are often produced by raster scanning a probe over the sample. However, an array of probes can also be used to either reduce the number of steps used in a mechanical scan or all together perform electronic scanning. Probes are often antennas, such as open-ended waveguides. From a scan, a 2D matrix of measured data as a function of frequency is produced, which can then be processed into a contrast image of some sort. Microwave imaging can be performed in either the near-field or the far-field of an antenna or probe, depending on the distance between the probe and the sample, and other imaging requirements such as spatial resolution. When determining how to make a microwave image, the frequency of operation, probe type, and the specific imaging technique are all dependent on the sample properties, target features of interest and imaging requirement (e.g., resolution). The quality and characteristics of a microwave image can be evaluated in terms of a few essential metrics. One of the main metrics is spatial resolution. Spatial resolution can be thought of as the in-plane distance between two targets at which they can be distinctly distinguished from each other in the image (i.e., two targets look like two indications in the image rather than one). Another way to calculate the spatial resolution is the half-power width in the image indication of a point target. For this metric, a smaller number is considered to be a “better” or “higher” or “finer” resolution.
There are a few pros and cons that can be considered with each method of imaging. In the near-field imaging, the sample is placed in the near-filed region of the probe aperture while it is scanned. As such, the image resolution is mainly a function of the size of the probe and no the wavelength. This makes near-field imaging a high-resolution technique, but ot has its own drawbacks as well. Thus, by designing a probe with a relatively small footprint, high spatial resolution can be obtained. However, in the near-field of a probe, the fields tend to vary significantly as a function of distance to the probe. This means that near-field probes tend to be highly sensitive to changes in liftoff. To overcome this, a differential probe can be used. Another benefit of near-field imaging is the potential simplicity of the measurement system. For example, a standing wave detector can be used for this purpose. Microwave microscopy is closely related to near-field imaging and will be discussed more in a subsequent sub-section.
Another modality of imaging is lens-focused imaging. Lens-focused imaging uses a physical lens to focus microwaves in a small area at a specific distance, similar in operation and design to an optical lens. This provides for very high spatial resolution images. However, the focusing capabilities of lenses are frequency dependent and are limited to a specific focal distance and a limited depth-of-focus. In order to change the focal distance, a different lens needs to be used, or the lens detailed design structure must change. These limitations mean that lens-focused imaging is effectively a single-frequency/narrowband approach. Additionally, the lenses tend to be relatively expensive, and almost always custom designed and not readily available off-the-shelf. Pictures of several lenses designed to operate at three different frequencies are shown below.
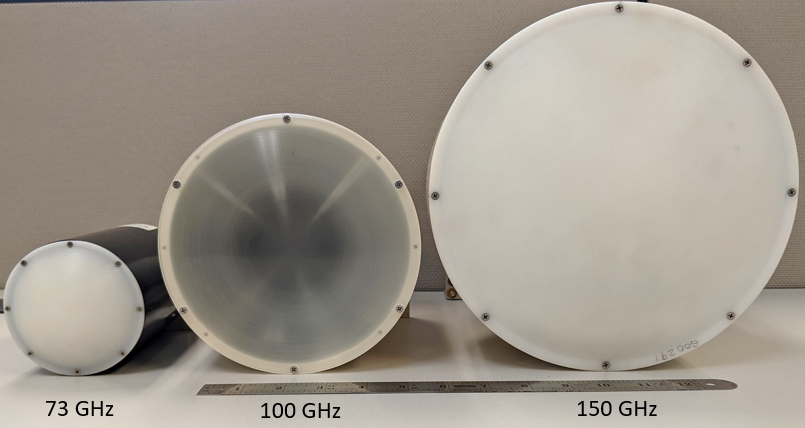
Microwave lenses that are designed for different operational frequencies.
A third imaging method is synthetic aperture focused imaging, which is also referred to as synthetic aperture radar (SAR) imaging. In SAR imaging, a small antenna, which typically has a relatively wide beamwidth, is scanned over the sample. By scanning the antenna over the sample and making a measurement at many points along the scan direction, a larger antenna with a smaller footprint is effectively synthesized or produced, which results in a higher spatial resolution. This synthesizing of a larger antenna is based on a mathematical compensation of the phase differences (also referred to as back propagation) that occur while the real antenna is scanned. These phase differences are due to the distance between the antenna and the target changing throughout the scan. Another way to think of SAR imaging is the coherent (magnitude and phase) addition and focusing of measured signals at a point of interest. This method of imaging, readily enables averaging is spatial and frequency domains, resulting in relatively high image signal-to-noise (S/N) ratio (i.e., image fidelity). A schematic of the SAR imaging process is shown below.
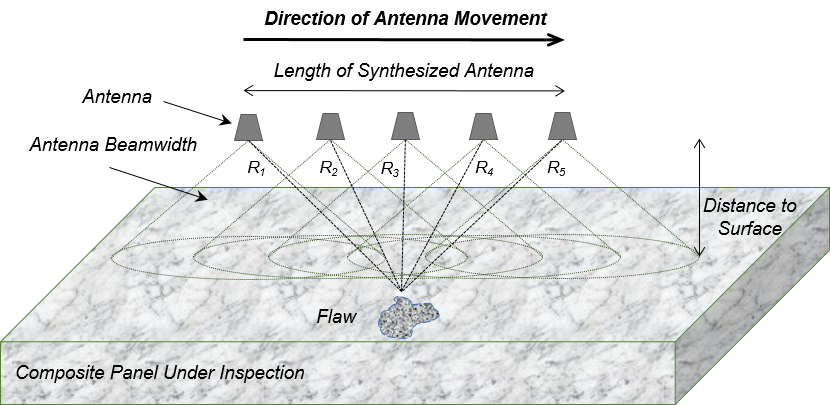
SAR imaging process schematic.
SAR imaging can be performed with either single frequency measurements or with measurements that are done over a band of frequencies. By using a larger bandwidth, a higher fidelity image can be achieved along with higher depth resolution. Depth resolution can be defined with the following equation:
In the equation, v is the wave phase velocity in the material while B is the transmitted signal bandwidth used in the measurements. When the bandwidth is increased, the depth resolution is calculated as a smaller number. This number, similar to spatial resolution, can be interpreted as the distance between two targets at which they can be distinguished from each other in the image, ut in the direction of signal ravel (i.e., range direction). As such, a smaller number is viewed as a “better” or “higher” or “finer” resolution. Spatial resolution in SAR imaging is a function of the liftoff, scan dimensions, step size, and wavelength.
As an example of a microwave imaging scenario, consider the flat bottom hole sample made out of High Density Polyethylene (HDPE, which is polymer) below. This sample contains holes of three different radii and five different depths, for a total of 15 holes. Due to the radius of the smallest hole and the spacing between the holes, a Ka-band (26.5-40 GHz) open-ended rectangular waveguide was selected as the probe. The probe was connected to a VNA in order to make the measurements (S11 at each measurement location). At 26.5 GHz the wavelength is ~11 mm. This sample was scanned at two different standoffs (i.e., distances between the probe aperture and the sample), namely: 16.5 mm and 36.5 mm to produce near-field and far-field microwave images. A 260 x 260 mm area was scanned with a step size of 3 mm in both the X and Y directions.
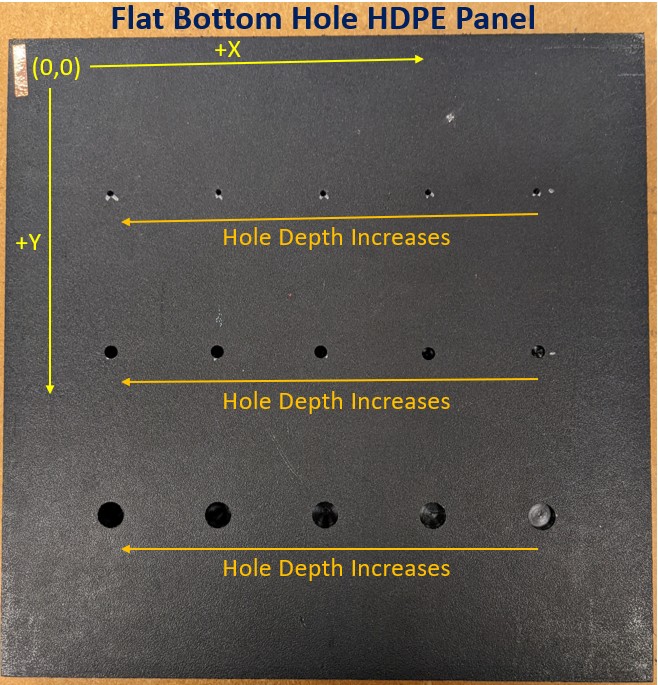
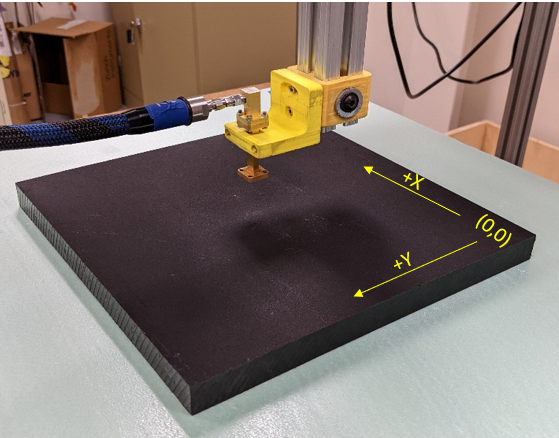
HDPE flat bottom hole sample and the scan setup.
From these scans, four images were produced, which are shown below. The top left image shows the raw imaging data at a frequency of 26.5 GHz and a standoff of 36.5 mm, while the top right image shows the same but at a standoff of 16.5 mm. On the bottom left, the wideband synthetic aperture radar (SAR) image is shown. In this image, all of the frequency points (201 points between 26.5 and 40 GHz) from each measurement point (7569 points) are included in the imaging algorithm that produces a higher resolution, high fidelity image. The bottom right image shows a single frequency SAR image focused at the bottom of the sample. In comparing the SAR images to the raw images, it can be seen that all 15 holes are clearly visible in the SAR image with better contrast between the holes and the background, and the size of the image indications is more on par with the physical size of the holes. In comparing the two SAR images, it can be seen that the wideband image appears clearer.
Another feature of the SAR algorithm is that it allows the user to focus at different depths (i.e., create image slices at different distances and depths within a target). The image shown below is focused at a distance of 60 mm from the probe aperture which corresponds to the bottom of the sample. Since the bottom of the sample in the scan configuration is the side that the holes were cut into, all 15 holes are visible at this depth. However, if we were to instead focus at a closer distance (e.g., 45 mm) some of the shallower holes would no longer be visible in the SAR image. This also means that 3D images can be reconstructed from SAR image data. An example of this is shown below. Two indications can be seen for each hole in the panel: one that indicates the bottom of the hole and another where the hole opening begins. From this image the varying depth of the holes can be seen, especially for the largest radii holes.
| Raw Data: 26.5 GHz, 36.5 mm standoff | Raw Data: 26.5 GHz, 16.5 mm standoff |
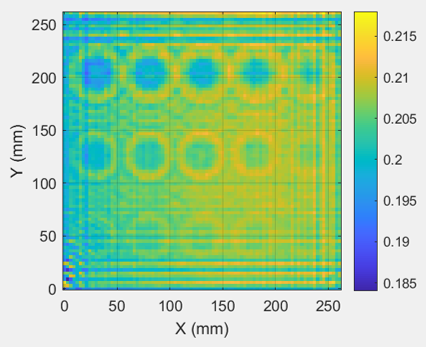 |
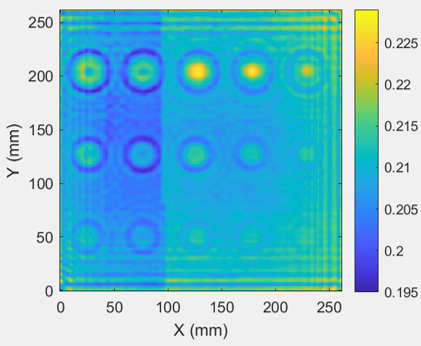 |
| SAR Data: Wideband, focused at bottom of sample: z=-60 mm | SAR Data: Single Frequency (26.5 GHz), focused at bottom of sample: z=-60 mm |
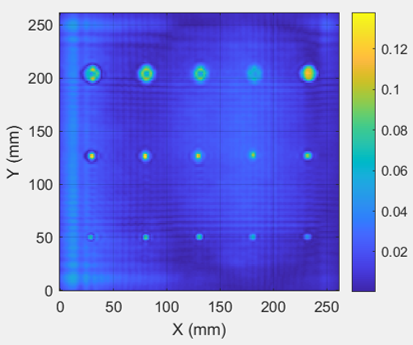 |
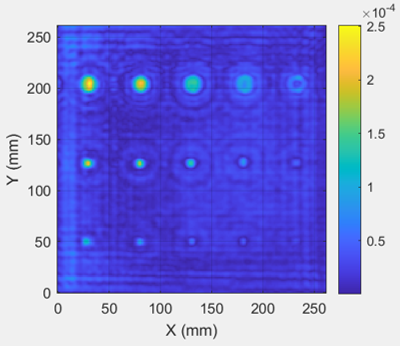 |
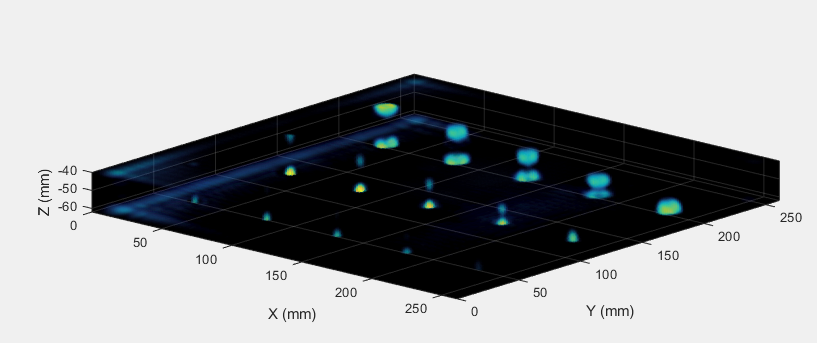
3D SAR image of HDPE flat bottom hole sample.
Another area of focus in the field of microwave imaging has been the development of microwave cameras. Microwave cameras combine arrays of antennas with very fast-switching RF electronics to create a contained system capable of making microwave images quickly (e.g., 30 frames per second).