Introduction to POD
Outcome of a POD Study
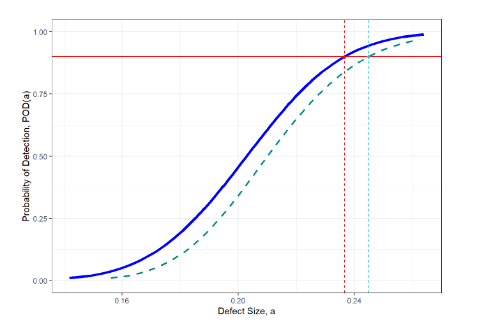
An excellent place to start in understanding POD is at the end! Understanding where the study is eventually going will help put into context each step and where it fits. There are two outcomes of a POD evaluation to understand the reliability of an inspection. The first is a POD curve, such as the one shown in Fig. 3. The second is an estimate of the false call rate of the inspection, which will not be discussed in great detail here but is critical in truly evaluating an inspection. What the curve in Fig. 3 gives is the probability of detecting a flaw as a function of the size of that flaw. It shows the mean POD curve in blue and the confidence interval on the POD curve in dashed green. In looking at the mean curve, it can be seen that the probability of detecting a flaw is zero (POD(a)=0) when the flaw has a length of zero, and ideally the probability approaches 1 (POD(a)=1) as the flaw size grows very large. In other words, flaws of length zero are not detectable, and large flaws with lengths approaching infinity are detectable with probability of 1. This functional form assumes that the probability of detection is non-decreasing as flaw size increases. The confidence interval builds conservatism into the estimates of POD by taking into account imperfect information from the POD study itself. This will be discussed in more detail in a later section.

Figure 3. Figure showing a POD curve and uncertainty bounds on the curve calculated from simulated data. The curve shows that as flaw size approaches zero, the probability of detecting the flaw also decreases, and as flaw increases, the probability of detecting the flaw increases. POD(a) describes the probability of detection for a flaw of size a. The uncertainty bound, or confidence interval, builds conservatism into the estimates based on uncertainty from the POD study itself.
Two Primary Types of POD Study
NDE inspections often fall into one of two categories: inspections where a signal value from an instrument is reported (e.g. eddy current or ultrasound) or inspections where only flaw detections are reported (e.g. fluorescent penetrant or magnetic particle). In POD, these two categories of inspections are referred to as â vs a and hit/miss. The methods for analyzing data from these different types of inspection are different, and this article will specifically focus on â vs a data as it provides for better understanding of the fundamentals of POD. However, it should be noted here that inspections where signal values are reported can be converted and analyzed as hit/miss by choosing a signal threshold. A full understanding of hit/miss data analysis requires logistic regression, and excellent reviews of that subject are given in [2-4].
Uncertainty in an Inspection
Every inspection has uncertainty associated with it. For instance, no manufacturing process is perfect in practice; there will be subtle but important differences between probes that are nominally identical. The design of NDE sensors is guided by parameters defining the shape, position, and material properties that make up the sensor, among other aspects. These parameters dictate how a particular probe will respond to a given flaw. In theory, each of these parameters could be known exactly and tied to specific probe serial numbers, but in practice these parameters are not known. In other words, they are uncertain parameters. Furthermore, beyond sensor design, when thinking about one inspection among many that will be performed on an entire fleet of components throughout the life of the component, each has myriad uncertain parameters related to human factors, component geometry and property variability, probe characteristics, instrument noise, environment changes (e.g. temperature shifts), etc.
In POD, the objective is to quantify the impact that this uncertainty could have on the detectability of flaws. Given that these parameters are uncertain, and that all inspection equipment has noise, the signals that will be recorded from a flaw in an arbitrary inspection are also uncertain. POD then gives a measure of how likely it is that the flaw will be detected in the case of hit/miss or how likely it is that the signal will be above a rejectable threshold in the case of â vs a in an arbitrary inspection from among all the inspections that will be performed through the life of the component.